Section 5.1 Surfaces
There are many ways to describe a surface. Consider the following descriptions:
The unit sphere;
\(x^2+y^2+z^2=1\text{;}\)
\(r=1\) (where \(r\) is the spherical radial coordinate);
\(x=\sin\theta\cos\phi\text{,}\) \(y=\sin\theta\sin\phi\text{,}\) \(z=\cos\theta\text{;}\)
\(\rr(\theta,\phi) = \sin\theta\cos\phi\,\xhat + \sin\theta\sin\phi\,\yhat + \cos\theta\,\zhat\text{;}\)
all of which describe the same surface. Here are some more ways of describing surfaces: (Are these descriptions of the unit sphere?)
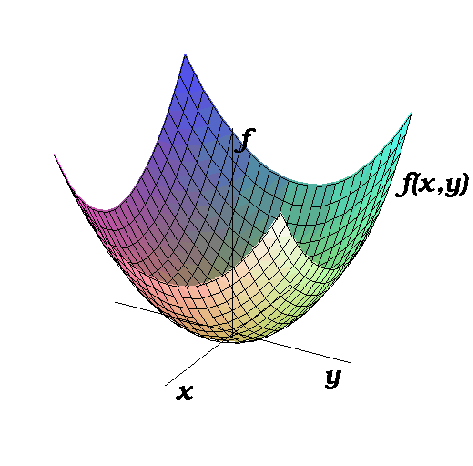
The graph of \(z=x^2+y^2\text{;}\)
The graph shown in Figure 5.1.1.
Which representation is best for a given problem depends on the circumstances. Often you will have to go back and forth between several representations.